
July 26, 2026
2026 Edge-first Observability: Monitoring When Connectivity and Reach Are Constrained
Why poller-to-central monitoring breaks at hard-to-reach sites, and how agent-based, edge-first observability keeps discovery and scanning alive when the WAN does not.
2026 edge-first observability: monitoring when connectivity and reach are constrained is not a theoretical problem anymore. According to SolarWinds research, 77% of IT teams still lack end-to-end visibility across their hybrid environments, and that gap widens fast once your infrastructure sits past the last mile of reliable connectivity.
We built ServiceRadar because watching a beefy EPYC server in a colo is easy. Watching a Ubiquiti gateway behind a flaky cellular uplink at a remote substation, a retail site with an unreliable ISP, or a tiny ARM-based edge gateway in a cabinet nobody visits twice a year is a completely different engineering problem.
Key takeaways
| Question | Answer |
|---|---|
| What does edge-first observability mean? | Monitoring that runs and reasons locally, at the edge gateway itself, instead of assuming a constant, low-latency link back to a central dashboard. |
| Why do traditional distributed monitoring systems struggle here? | Tools like Nagios, Zabbix, and Checkmk were designed around a poller-to-central-server model that assumes stable network paths, not intermittent power and connectivity. |
| How do agents help with hard-to-reach sites? | Agent-based telemetry lets a local process buffer, pre-aggregate, and only forward what matters once a link is available, per our architecture documentation. |
| What hardware does an edge-first monitoring stack need? | Anything from EPYC-class servers down to ARM gateways, provided the agent binary stays portable and cross-compile friendly. |
| How fast can edge-first scanning realistically run? | Our own SYN scanner went from 19 hours to under one second for the same sweep, detailed in our TCP scanner benchmark. |
| Can plugins run safely on constrained edge hardware? | Yes, with a capability-based, deny-by-default model, as explained in our plugin system writeup. |
| Is a full rip-and-replace of Zabbix, Icinga, or PRTG required? | No. Edge-first observability layers agent-based telemetry and cloud-integrated dashboards on top of what already works, then fills the gaps those tools leave at the edge. |
What edge-first observability actually means in 2026
Edge-first observability flips the traditional monitoring assumption on its head. Instead of a central server polling remote devices over a wide-area link, the intelligence moves to the edge itself.
An agent sitting next to the equipment it watches does not need a live connection to do its job. It discovers, scans, and evaluates locally, then syncs upstream when the path is available.
This matters because reach in 2026 rarely means a clean fiber run to a data center. It means a cellular backhaul at a remote cell site, a satellite uplink on a ship, or a branch office router that reboots every time the power flickers.
Our introduction documentation puts it plainly: know what is on the network without stitching together five different systems to find out.
Why traditional distributed monitoring systems break at the edge
We have run and evaluated most of the classics. Checkmk distributed monitoring, Zabbix distributed monitoring, Nagios distributed monitoring, PRTG distributed monitoring, Icinga2 distributed monitoring, and Prometheus distributed setups all assume something edge-first environments cannot guarantee: a stable path home.
Nagios XI distributed monitoring and its open-source cousin were built around a check-and-alert loop that expects the central server to be reachable on a predictable interval. When the link drops for six hours because a storm took out a regional ISP, you do not get no data. You get false alerts, flapping states, and an on-call engineer chasing ghosts.
Prometheus distributed monitoring solves part of this with federation, but federation still assumes each Prometheus instance has enough local compute and enough network stability to serve scrape targets reliably. Drop that instance onto a tiny ARM gateway with intermittent power, and you are fighting the tool instead of the outage.
Our network discovery workflow used to take longer than a transatlantic flight. That is not a criticism of any one vendor. That is what happens when a monitoring architecture built for stable data centers gets pushed to the edge without rethinking the assumptions underneath it.
Agent-based telemetry for hard-to-reach sites
Agent-based telemetry is the fix, and it is not a new idea so much as an old idea done properly. Instead of a central poller reaching out, a local agent watches, buffers, and forwards.
ServiceRadar agents run on everything from beefy EPYC servers to tiny ARM-based edge gateways. That range matters because a distributed network monitoring system that only performs well on server-grade hardware is not actually distributed. It is centralized with extra steps.
For hard-to-reach sites, the agent handles discovery, SNMP polling, and health checks locally, then ships results over a secured gRPC config stream once connectivity returns. Nothing gets lost because the agent never depended on the link to do its job in the first place.
Zero CGO and Wasm-first extensibility for constrained hardware
Portability is not optional when your monitoring targets range from a rack in a data hall to a fanless box bolted to a pole. We adopted a strict Zero CGO mandate across the agent codebase so builds stay cross-compile friendly, whether the target is x86_64 or ARM.
Extensibility is where things get harder. Traditional scripting runtimes force you to carefully deny access to dangerous APIs, one at a time, forever chasing the next escape hatch a plugin author finds.
We went the other direction. Running untrusted code safely is a solved problem, if you are willing to use WebAssembly.
By using a pure Go Wasm implementation via Wazero, we keep our agent builds portable and do not have to worry about linking against libwasmtime or managing shared libraries on a remote customer site. Plugins get zero access to system resources by default. An admin must explicitly approve the capabilities a plugin requests, for example wanting to talk to an internal API on port 443, before it ever runs.
Our vision is a library of community-driven, community-verified plugins that make this the most extensible monitoring platform on the market, without ever asking an operator to trust a script blindly on hardware they cannot physically walk over to.
Benchmarking edge-first observability: from 19 hours to under a second
Reach is not only about connectivity. It is also about how fast you can sweep a network segment before the window closes on you.
We internally challenged ourselves to deliver near-real-time visibility across large subnets, the kind you find in carrier networks or sprawling campus deployments. Our legacy TCP scan approach took roughly 19 hours to sweep a target range that mattered.
The result is a Go-powered SYN scanner that now finishes the same job in under one second. That is not a rounding error. That is a different category of tool, and it is what makes distributed monitoring across hundreds of hard-to-reach sites practical instead of theoretical.
Monitoring network and power instability at the edge
Edge sites do not just lose connectivity. They lose power, reboot mid-poll, and come back up with half their interfaces renegotiating. Any distributed monitoring system that assumes clean state transitions will misreport half of what happens at a site like this.
We have documented this directly against real hardware. Monitoring a Ubiquiti Dream Machine over SNMP means pulling the right OIDs for WAN state, DHCP leases, and interface counters, then interpreting a reboot correctly instead of firing a false device-down alert. For sites where you cannot rely on SNMP alone, a targeted sweep and banner grab fills the gap.
Cloud-integrated dashboards without centralizing everything
Edge-first does not mean edge-only. You still want cloud-integrated dashboards that give a single view across every hard-to-reach site, without forcing every byte of telemetry through a WAN link first.
The trick is deciding what gets aggregated locally and what gets forwarded. Adaptive telemetry at the edge, filtering, downsampling, and pre-aggregating before anything leaves the site, is what keeps a dashboard useful instead of overwhelmed.
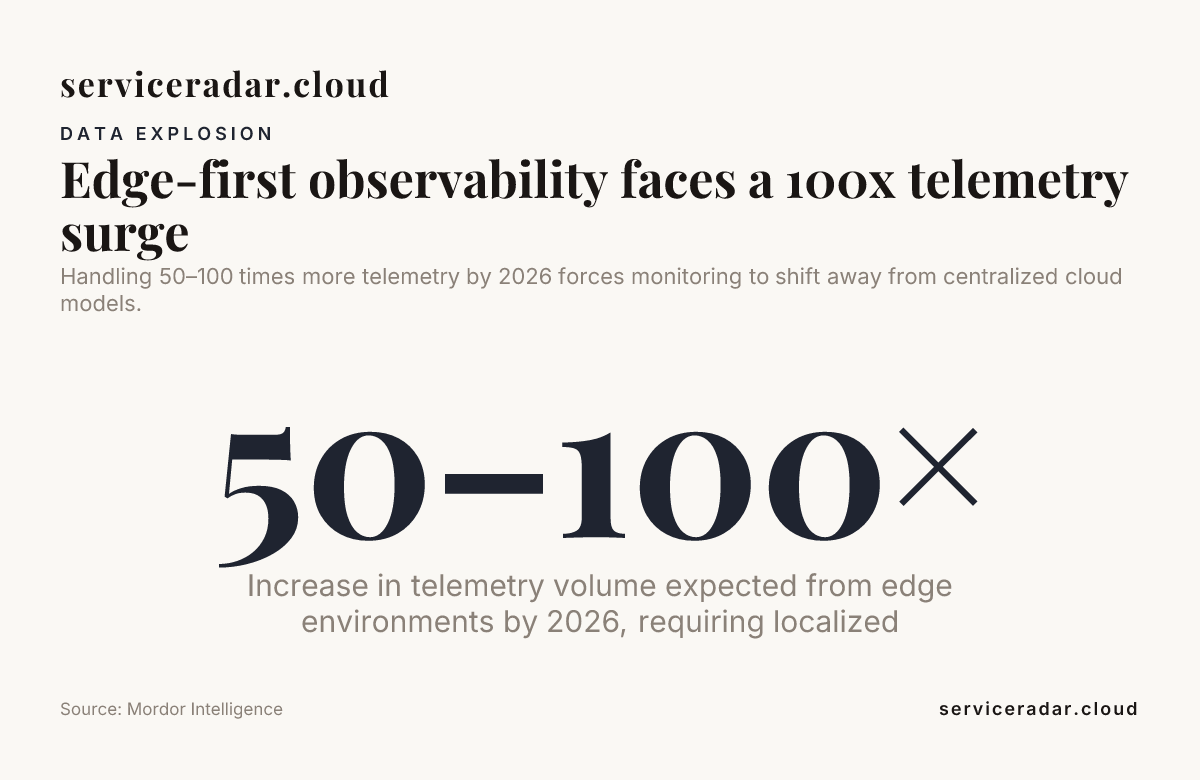
That reduction matters more every year. Microservice and serverless designs already push 50 to 100 times more telemetry through a pipeline than the monolithic architectures they replaced, and none of that volume is free to move over a constrained WAN link.
Roughly 29% of organizations are already pulling observability workloads back from the cloud toward on-premises and edge deployments specifically to control this cost and data-gravity problem, according to Elastic 2026 observability research. Edge-first architecture is not a fringe preference anymore. It is a cost strategy.
From fragmented to fluid: unifying the backend stack
None of the edge work matters if the backend receiving it is a pile of loosely-coupled services held together with cron jobs. We went through our own consolidation, moving from a fragmented setup toward a unified stack built on Elixir, Rust, and CloudNativePG.
Elixir gives us the concurrency model to handle bursty reconnections from hundreds of edge gateways coming back online after an outage, without falling over. Rust handles the performance-critical paths where every millisecond of processing counts. CloudNativePG keeps storage boring and reliable, which is exactly what you want underneath a distributed monitoring system.
Choosing a distributed monitoring system for 2026
Every team evaluating a distributed monitoring system in 2026 is really asking one question: what happens when a site goes dark? Here is how the common approaches stack up on that specific point.
| Platform | Distributed model | Behavior during connectivity loss |
|---|---|---|
| Nagios / Nagios XI | Central server polling, optional passive checks | Flapping alerts, missed checks during outages |
| Zabbix | Proxy-based distributed polling | Proxies buffer some data, but proxy hardware still needs stable local resources |
| Icinga2 | Master/satellite zones | Satellites queue checks, but zone reconnect logic can be brittle at scale |
| Checkmk | Distributed monitoring via WATO sites | Requires consistent site-to-site sync; gaps during long outages |
| PRTG | Remote probes | Probes cache locally, limited by probe host resources |
| Prometheus | Federation / remote write | Instance must survive independently; no native long-term local buffering |
| ServiceRadar | Zero CGO agents, Wasm plugins, gRPC config stream | Full local discovery and scanning continue offline; syncs on reconnect |
None of these tools are bad. They are built for different assumptions, and most of them were designed before edge meant thousands of unattended, intermittently-connected sites.
The best starting point for evaluating any of them against a real edge-first observability project is our quickstart guide, which gets you collecting data from a constrained site within an hour, with links to deeper docs on deployment, ingestion, and security features.
Security considerations when reach is constrained
A remote site you cannot physically reach is a site you have to secure remotely, correctly, the first time. mTLS between agent and core is not a nice-to-have here. It is the only thing standing between an unattended gateway and an attacker on the same segment.
Capability-based plugin security matters even more at constrained sites, since nobody is walking over to check what a rogue script did to a device you cannot currently see. If you want to go deeper on the encryption and authentication model underneath all of this, our go-deeper documentation and query and analysis docs cover the full path from packet to dashboard.
Conclusion
2026 edge-first observability comes down to one architectural decision: whether your monitoring logic lives at the edge or only visits it occasionally over a fragile link. Legacy distributed monitoring systems built for stable data centers were not wrong for their era. They just were not built for thousands of intermittently-connected gateways running on ARM hardware behind unreliable power.
We built ServiceRadar around Zero CGO agents, Wasm-first plugin security, and a backend that can absorb hundreds of sites reconnecting at once, because that is what edge-first observability actually demands in 2026. Start with our platform overview if you are deciding whether your hard-to-reach sites need this kind of architecture, and check the architecture documentation before you commit to any distributed monitoring system for 2026.
Frequently asked questions
Is edge-first observability worth it in 2026, or is it overkill for a small network?
If you manage even a handful of hard-to-reach sites with unstable connectivity or power, edge-first observability pays off fast, since agent-based telemetry keeps working when the link does not. For a single data center with a reliable network, a traditional centralized setup is often still simpler and cheaper.
Can I combine ServiceRadar with my existing Zabbix, Nagios, or Icinga2 deployment?
Yes. Most teams do not rip out a working distributed monitoring system. They add agent-based telemetry at the edges where their existing Zabbix, Nagios, or Icinga2 setup struggles with reach and reconnect logic.
How does distributed network monitoring handle sites with unstable power?
A properly designed distributed monitoring system buffers state locally through an agent that survives reboots and power flicker, then reconciles with the central dashboard once the site stabilizes. This is exactly why we run our agents Zero CGO, so they restart cleanly on constrained ARM hardware without dependency headaches.
What makes edge observability different from traditional cloud monitoring?
Edge observability moves discovery, scanning, and evaluation onto the device closest to the infrastructure being watched, instead of requiring a constant round trip to a cloud dashboard. That difference is what lets monitoring continue through the exact connectivity gaps that break centralized tools.
Are Wasm-based plugins actually safer than traditional monitoring scripts?
Yes, because a capability-based, deny-by-default model means a plugin has zero access to network or system resources until an admin explicitly approves it. That is the opposite of a traditional scripting runtime, where you are stuck denying dangerous APIs one at a time after the fact.
How much can edge-first monitoring reduce the telemetry I send to the cloud?
Adaptive telemetry filtering at the edge can cut forwarded data by 50 to 80%, according to Grafana Labs, which matters a lot once you are dealing with the 50 to 100 times more telemetry that modern microservice and serverless architectures generate. Cloud-integrated dashboards stay useful specifically because they are not drowning in raw data from every site.
Do I need SNMP for edge-first monitoring of consumer-grade or prosumer gateways?
SNMP still works well for devices like the Ubiquiti Dream Machine, provided you are pulling the correct OIDs for WAN and interface state instead of guessing. For anything without a clean MIB, a targeted sweep and banner grab is a reliable fallback to confirm what is actually alive on the segment.